Imagine having a control center that updates itself while you sleep. A place where your projects, habits, and goals live in perfect harmony, changing in real-time without you ever clicking a refresh button. That is the power of an automated live dashboard in Notion. Instead of treating your workspace like a static notebook, you can turn it into a living, breathing ecosystem.
Building these dynamic setups is easier than it looks, and you do not need to know how to code to make it happen. By mixing core database features with native connections, you can build a command center that works for you. Let us dive straight into how you can connect your data, streamline your daily views, and build a truly automated dashboard from scratch.
Understanding the Magic Behind Live Dashboards
Before you start building, it helps to understand what actually makes a dashboard “live.” In the world of Notion, static pages require you to manually type in updates every single day. If you finish a task, you have to move it, change the date, and rewrite your progress percentage. A live dashboard completely eliminates that busywork.
The secret lies in Notion databases. Unlike a standard page where words just sit on the screen, databases store information in structured blocks that can talk to each other. When you change a piece of information in one place, every single view connected to that data updates instantly across your entire workspace.
To make this automation happen without external tools, we rely on three foundational features:
- Database Relations: These act like bridges that connect two completely separate tables, allowing them to share data seamlessly.
- Rollups: These act like scouts that run across those bridges, grab specific numbers or information, and bring them back to your main view.
- Formula Properties: These act like calculators that take your data and automatically turn it into progress bars, visual alerts, or countdowns.
By combining these three ingredients, you create a system where tracking a single daily habit automatically updates your weekly goals, your monthly review, and your yearly progress tracker all at the same time.
Setting Up Your Core Database Architecture
Every great dashboard needs a strong foundation. Instead of building your dashboard directly on a blank page, you want to create your backend databases first. Think of these as the engine room of your workspace. They hold all the raw data, while your front dashboard will simply display that data in a clean, beautiful way.
For a truly automated live system, you should create three distinct databases. You can create these by typing the forward slash command and selecting the full-page database option.
The Yearly Master Blueprint
This database holds your big-picture visions. It is where you define your major themes for the year, like learning a new language, saving for a major purchase, or building a fitness routine. It requires very few properties to start:
- Name: The title of your major milestone or year.
- Status: A simple select menu to show if the goal is active, paused, or completed.
- Progress: A rollup property that we will configure later to calculate your success automatically.
The Monthly Action Tracker
This database breaks your big yearly goals into smaller, digestible chunks. It helps you focus on what matters right now without getting overwhelmed by the scale of your long-term plans.
- Month: The name of the specific month.
- Date Range: A property that defines the exact start and end dates of that month.
- Current Focus: A text field where you state your main priority for those four weeks.
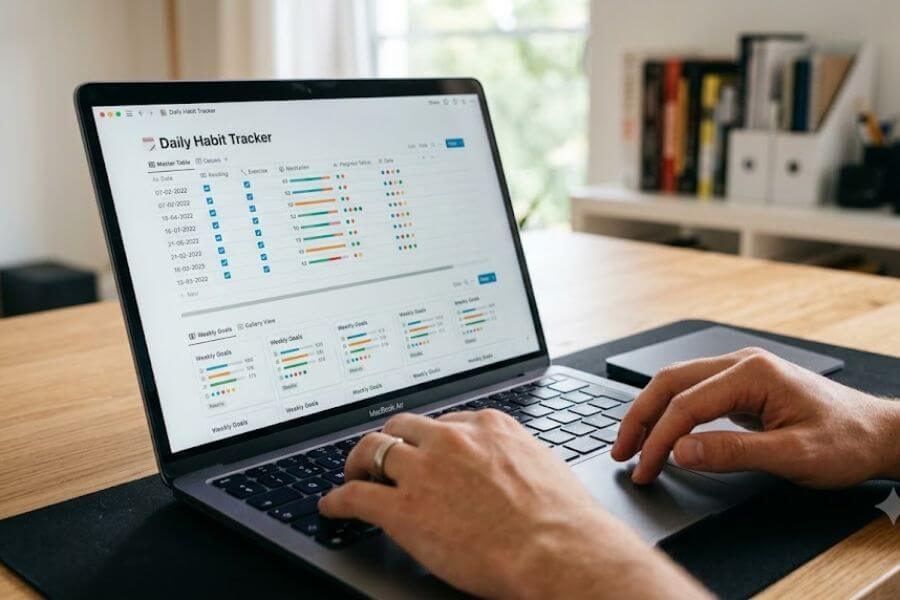
The Daily Log and Habit Tracker
This is your everyday workspace. It is where the actual action happens. Every morning you will create a new page here, and every evening you will check off what you accomplished.
- Date: The exact calendar day.
- Habit Checkboxes: Simple boxes for things like reading, exercising, drinking water, or practicing a skill.
- Completion Rate: A formula that calculates how many checkboxes you ticked today.
Connecting Your Data with Relations and Rollups
Now that your three backend databases are ready, it is time to build the digital pipelines that connect them. Without these connections, your data will remain isolated. Once connected, an update on a daily page will automatically flow upwards to change your monthly and yearly statistics.
Step One: Connecting Daily Logs to Months
Open your Daily Log database. Add a new property and select the relation option from the menu. Notion will ask which database you want to connect to. Choose your Monthly Action Tracker.
Once the relation is created, give it a clean name. Now, when you open a daily page, you can click into this relation field and select the current month. This tells Notion exactly where today’s data belongs.
Step Two: Linking Months to Years
Open your Monthly Action Tracker database. Add another relation property, but this time, connect it to your Yearly Master Blueprint. Link each month to the corresponding year.
You have now created a complete chain of command. The daily pages talk to the monthly pages, and the monthly pages talk to the yearly pages.
Step Three: Bringing Data Forward with Rollups
With your relations active, you can now use rollups to calculate live statistics. Go to your Monthly Action Tracker. Add a new property and choose rollup.
In the rollup configuration settings, look at the three options:
- Relation: Select your link to the Daily Log database.
- Property: Choose the habit checkbox you want to track, such as reading.
- Calculate: Change this setting from “Show original” to “Percent checked.”
Instantly, Notion will look at every single daily log connected to that month, see how many times you read books, and show you an exact, live percentage of your success rate for that month.
Creating Advanced Formulas for Live Progress
Percentages are great, but a live dashboard really shines when it uses visual cues to show your progress. Notion formulas allow you to turn boring numbers into visual progress bars and status indicators that update automatically.
To create a visual progress bar, add a formula property to your monthly tracker and name it Progress Bar. Click inside the formula box to open the editor. We want to take the rollup percentage you just made and turn it into a visual graphic.
You can use a simple repetition formula to achieve this effect. By telling Notion to repeat a solid square icon based on your percentage value, and a hollow square icon for the remaining percentage, you create a custom progress bar. The basic logic looks like this:
Plaintext
slice("██████████", 0, round(prop("Rollup Percent") * 10)) + slice("░░░░░░░░░░", 0, 10 - round(prop("Rollup Percent") * 10))
This formula takes your live mockup percentage, rounds it to the nearest tenth, and displays a beautiful progress bar that grows across your screen as you complete tasks in your daily log.
You can also create dynamic status messages that change based on your performance. For instance, you can write a formula that checks your progress percentage. If your completion rate is below thirty percent, the formula can automatically display a red warning light icon and the words “Needs Attention.” If your progress crosses seventy percent, it can switch to a green checkmark icon and say “On Track.” This gives you instant feedback the moment you open your page.
Building Your Front Dashboard View
With your backend databases built, connected, and supercharged with formulas, you can finally build your front dashboard. This is the main page you will look at every single day.
Create a brand-new blank page in your sidebar and title it Master Dashboard. Clear everything off the page so you have a clean canvas to design your ultimate workspace.
The Power of Linked Views
The biggest mistake people make is copying and pasting their databases onto their main page. Doing that creates messy duplicates. Instead, you want to use linked views of your existing databases.
Type a forward slash on your blank page and select “Linked view of database.” Choose your Daily Log database from the list. A perfect mirror of your daily log will appear on your dashboard.
The magic of a linked view is that you can change how it looks without altering the original raw data. You can hide messy properties, change the layout, and add specific filters while your backend remains completely safe and organized.
Arranging Your Dashboard Layout
To make your dashboard look like a professional website, you should organize your layout into columns. You can do this by typing a forward slash and choosing the column option, or by dragging blocks next to each other until a blue vertical line appears.
A clean, high-functioning layout follows a simple blueprint:
| Column One (Left Side) | Column Two (Right Side) |
| Quick Action Buttons: One-click shortcuts to add new logs instantly. | The Daily Focus View: A clean gallery view showing only today’s habits. |
| Navigation Links: Fast shortcuts to your hidden backend data pages. | The Monthly Overview: A list view displaying your live progress bars. |
| Current Quote: A simple text block for your weekly inspiration. | The Yearly Milestones: A board view showing your grand status. |
This column layout keeps your workspace compact. It prevents you from having to scroll down a long page to find your information, keeping everything visible at a single glance.
Mastering Filters for True Automation
A dashboard is not truly live if you have to manually change the filters every time the sun goes down. To make your dashboard smart, you must utilize relative dates and dynamic filtering systems.
Setting Up the Today Filter
Click on the linked view of your Daily Log database on your main dashboard. Open the filter menu and select the Date property. Instead of picking a specific calendar day, click the dropdown arrow and choose the relative option called “Today.”
This step changes everything. When you open your dashboard tomorrow morning, yesterday’s log will automatically vanish from this view, and a blank space for the new day will appear. The old data is not deleted; it is simply safely hidden away in your backend database, keeping your main dashboard clean and focused exclusively on the present moment.
Crafting the Current Month Filter
Next, look at your Monthly Action Tracker linked view. You do not want to see past months cluttering your workspace. Open the filter settings for this view, select your Date Range property, and choose the option that says “Is within this month.”
Now, Notion will look at your computer internal clock, calculate the current month, and show you only the goals, priorities, and progress bars that matter for these specific four weeks. The moment the month transitions, your dashboard will update its entire interface automatically.
Designing One Click Automated Buttons
To speed up your daily workflow, you can use Notion native button property. This feature allows you to automate repetitive clicks with a single press, making data entry completely seamless.
Type a forward slash on your left column and select the Button block. Name your button “Start New Day.” Inside the button settings menu, you can program a sequence of actions to run automatically:
- Step One: Tell the button to add a new page to your Daily Log database.
- Step Two: Set the name of the new page to automatically match the current date.
- Step Three: Tell the button to automatically edit the Month relation property and link it directly to the current month.
- Step Four: Program the button to open the newly created page as a centered pop-up window on your screen.
Now, instead of navigating through your backend databases, clicking new, typing the date, and linking your relations manually, you simply tap your custom button. In a fraction of a second, your entire daily setup is built, linked, and ready for you to write in.
Customizing Layouts for Visual Clarity
The way your data looks matters just as much as how it functions. A wall of boring tables can make your workspace feel uninspiring. Notion allows you to change the visual layout of your linked databases with a few clicks.
The Gallery View for Daily Habits
For your Daily Log view at the top of your dashboard, switch the layout from a standard table to a gallery view. In the card preview settings, turn off the page content preview and select none. This turns your daily log into a clean, minimalist card.
Go to the properties menu inside the gallery settings and click the eye icon next to your habit checkboxes. This forces the checkboxes to appear directly on the outside of the card. Now, you can check off your daily reading or workout directly from your main dashboard without ever opening the page.
The Board View for Yearly Milestones
For your Yearly Master Blueprint, switch the layout to a board view. Group the columns by your status property. This creates a highly visual kanban board where your grand life goals are sorted into clear columns like “Not Started,” “In Progress,” and “Achieved.”
As your rollup formulas update your progress behind the scenes, you can easily see which areas of your life need more focus and manually slide them across columns when goals are reached.
Maintaining and Optimizing Your System
Even the best automated dashboards can slow down if they are stuffed with unnecessary clutter. To keep your live workspace running fast and smooth, you should practice good digital maintenance.
- Keep Backends Separate: Never store your original master databases directly on your dashboard. Always keep them tucked away on a dedicated backend page, using only linked views on your main display. This prevents accidental deletions.
- Limit Gallery Previews: If you use gallery views, set the load limit to show only ten or twenty cards at a time. Loading hundreds of visual cards simultaneously can slow down your device.
- Review Formulas Regularly: As your goals change, check your formula properties to ensure they are pointing to the correct property names. If you rename a habit checkbox, remember to update that name inside your formula editor too.
By spending just a few minutes reviewing your system structure at the start of every season, you ensure your automated workspace grows alongside you without breaking.
Frequently Asked Questions
Will my live dashboard work correctly on the Notion mobile app?
Yes, your automated dashboard will transfer over to the mobile application. Because all your filters, relations, and formulas are calculated on the cloud, your data will update in real-time whether you view it on a phone, a tablet, or a desktop computer. To make your mobile experience even better, the columns you designed on your desktop layout will gracefully stack into a single, clean vertical column on smaller phone screens, keeping your workspace highly readable on the move.
What happens to my old daily logs when the filter changes to a new day?
Your historical data is completely safe. When the relative date filter switches to a new day, your older logs simply hide from that specific dashboard view because they no longer match the active filter criteria. Your raw data remains safely stored inside your master backend database. You can view your entire history at any time by visiting your backend page or by creating a separate history archive tab on your main dashboard.
Can I track multiple separate habits using a single rollup property?
A single rollup property can only look at one specific property column at a time. If you want to track five different habits, you will need to create five separate rollup columns in your monthly tracker. However, you can create a single master formula property that combines all five of those rollups together, averaging their scores to give you a single overall daily success percentage.
Why is my progress bar formula showing an error message in red text?
Formula errors usually happen because of a tiny typo or a mismatch in property types. Make sure that the names of the properties typed inside your formula match the spelling and capitalization of your database columns exactly. Additionally, verify that your rollups are set to calculate numbers or percentages rather than displaying plain text, as mathematical formulas cannot perform calculations on non-numerical values.
Do I need a paid premium subscription to use these database automation features?
You do not need a paid account to use any of the features described in this guide. Advanced relations, rollups, formula properties, linked database views, and automated button blocks are all included in the standard free version of Notion. You can build, scale, and enjoy your fully automated live dashboard without ever having to worry about an upgraded plan.

